Social Media Content Study | Socialinsider
Social Media Insights | Global
Social media content is highly important, meanwhile, everyone has a favorite social media platform, and every marketer out there fights to get the best results on Facebook, Twitter, and Instagram. However, typically, social media marketers succeed on one platform more than the others.
But, what if in 2020 you have the chance to raise your engagement rate on all three with simple tweaks in your strategy?
The answer is in this social media content study report, keep on reading to learn how to write the perfect and most practical captions for Facebook, Instagram, and Twitter.
Brands Are More Likely to Post on Twitter Twice More Than on Instagram and Facebook Combined
It is reported that Twitter is by far the social media platform where brands interact the most, however, the overall engagement might be deceiving.
There is an average of 195 brand posts per month on Twitter. On the other side on Instagram, brands post only 25 posts per month, however when it comes to Facebook the average is 60 posts per month.
The chart below shows the average number of posts per month from 2017-2019
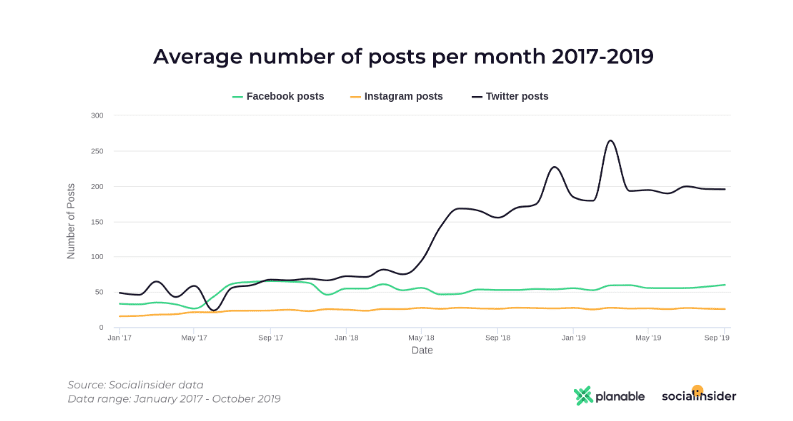
- As shown in the chart, sometime in May 2018. the average number of tweets per month almost tripled to what it is today.
- The trend of posting more on Twitter than the other social media platforms has been constant from 2017 until the present.
- Even though it looks like Twitter is the preferred social media platform, it is actually a tricky situation, with so many posts, there is a higher risk of having your messages ignored besides being lost in the feed.
Social Media Content Study: Average Engagement Rate Per Post by Profile Size:
The following chart shows the average engagement rate per post by profile size (On Facebook, Instagram, Twitter)
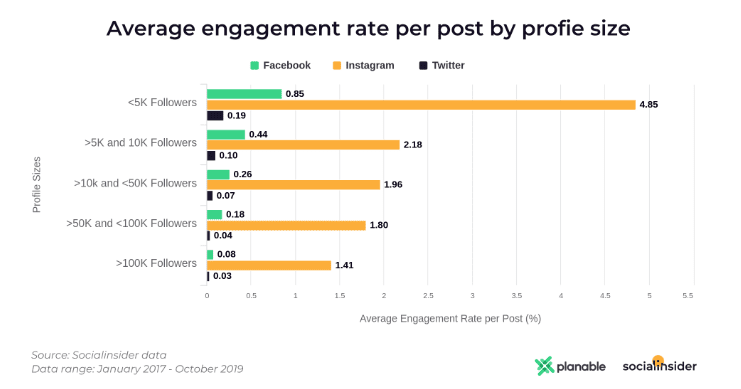
- In light of the social media content study, and as shown in the above chart social media profiles with fewer than 5,000 followers receive on average 4.85% engagement rate on Instagram, also 0.85% on Facebook along with 0.19% on Twitter.
- On the other side, profiles with between 5K and 10K followers receive on average 2.18% engagement rate on Instagram, 0.44% on Facebook, besides a percentage of 0.10% on Twitter.
- However, for the profiles with over 100K followers, they receive on average 1.41% engagement rate on Instagram, 0.08% on Facebook, and 0.03% on Twitter.
For further information, make sure to check the full social media content study report.
The Table of Content Of “Social Media Content Study Report”:
- Introduction
- Summary
- Key findings
- Brands post on Twitter twice more than on Instagram and Facebook combined
- Instagram is by far the most engaging platform
- Brands post the longest captions on Twitter
- Perfect posts
- Questions decrease engagement
- Contests and giveaways work
- Christmas posts work best on Facebook
- Methodology
Number of Pages:
- 24 pages
Pricing:
- Free
Methodology :
To gather the data for the posts with the highest engagement rate per post we looked at 101,421,493 posts from 178,463 profiles of different sizes, across all platforms. Within this report, we included representative business Instagram, Facebook and Twitter handles with an active presence on the platforms between 1st of January 2017 and 1st of October 2019.
The data was gathered as follows:
- Facebook: 137,486 profiles with 76,045,525 posts
- Instagram: 30,873 profiles with 7,653,440 posts
- Twitter: 10,104 profiles with 17,722,528 posts

Socialinsider
- Explore in-depth insights for any social media profile.
- Enhance social media strategy.
- Win pitches and maximize the revenue per client by driving engagement, improving the content strategy, and creating automated reports with ease.
- Measure your clients’ profiles.
- Perform competitive analysis in minutes across Facebook, Instagram, Twitter, and Youtube.
- Benchmark your channels.
- Add context to your digital strategy.
- Branded reports in seconds.
- Reports delivered to your inbox.
- Validate your social media efforts with reliable data, share the performance with your team and clients.
Services & Features:
- Facebook Analytics.
- Facebook Video Insights.
- Instagram Analytics.
- Twitter Analytics.
- YouTube Analytics.
- Hashtag Analytics.
- Instagram Stories Analytics.
- Facebook Boosted Post Detection.
- Competitor Tracking.
- Benchmarking.
- Downloadable reports (PDF, PPT).
- Downloadable posts (CSV).
- Automated reports.
- Reports in your language.
- API Access.
- Livechat and email support.
Pricing:
- Social Media Manager: $59 per month.
- Small Agency: $99 per month.
- Agency: $199 per month.
