Paid Media Benchmark Report, Q1 2019 | AdStage
Social Media Insights | Global
Due to the advantages of social media in connecting businesses to end-consumers directly, in a timely manner and at a low cost, social media has become the centre of attention in many industries by facilitating various areas of marketing, such as promotions, marketing intelligence, sentiment research, public relations, marketing communications, as well as product and customer management.
The quick growth in the usage of social media throughout the world shows that businesses can utilize it to increase their product or service interest in consumers.
If you want to tack up against your competitors on social media, you must read this Paid Media Benchmark Report includes data from 13.3 billion impressions and nearly 136 million clicks powered by the AdStage platform.
AdStage’s Paid Media Benchmark Report – Q1 2019 also includes stats on CPM, CPC, and CTR benchmarks for Facebook, Facebook Messenger, Instagram, Twitter, LinkedIn, Google Ads, Google Display Network, YouTube, and Bing Ads.
Related: 2019 Social Media Benchmark Report | Rival IQ
Facebook Audience Network & News Feed Benchmarks—Q1 2019
- Facebook audience network median cost per click (CPC) is $0.72 in the first quarter of 2019 which jumped from $0.30 since Q4 2018.
- Facebook cost per click (CPC) increased by 71.4% since Q4 of 2018.
- Facebook cost per click (CPC) increased with a year over year rate of 278.7% since Q4 of 2018.
- Facebook audience network median cost per thousand impressions (CPM) is $7.00 in the first quarter of 2019 which is jumped $0.68 more expensive since Q4 of 2018.
- Facebook cost per thousand impressions (CPM) increased by 10.8% since Q4 2018 and CPM increased by 191.1% year over year since Q1 2018.
- Facebook audience network median click-through rate (CTR) is 0.99% in the first quarter of 2019 which is dropped by 0.41% since the last quarter.
- Facebook CTR is decreased by 29,3% since Q4 of 2018.
- Facebook CTR is decreased with a year over year rate of 25.2% since Q1 of 2018.
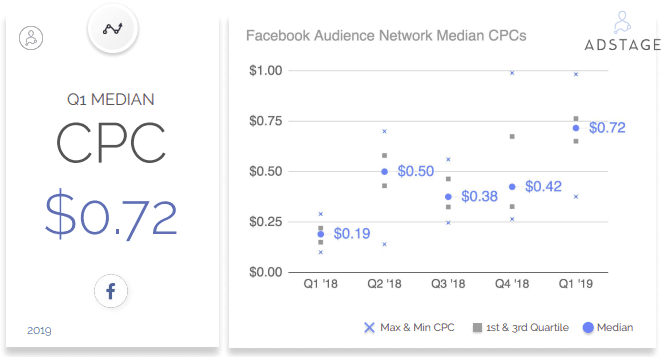
In Q1 2019, AdStage analyzed over 152 million ad impressions and over 1.5 million clicks for ads in Facebook’s Audience Network. Explore the Results Above
Instagram Benchmark—Q1 2019
- Instagram audience network median cost per click (CPC) is $0.83 in the first quarter of 2019 which is jumped just 3 cents since the last quarter.
- Instagram cost per click (CPC) increased by 3.6% since Q4 of 2018.
- Instagram CPC decreased with a year over year rate of 39.2% since Q1 of 2018.
- Instagram audience network median cost per thousand impressions (CPM) is $4.80 in the first quarter of 2019 which is 44 cents cheaper than the last quarter.
- Instagram cost per thousand impressions (CPM) decreased by 8.4% since Q4 of 2018.
- Instagram CPM decreased with a year over year rate of 39.9% since Q1 of 2018 by dropping $3.11.
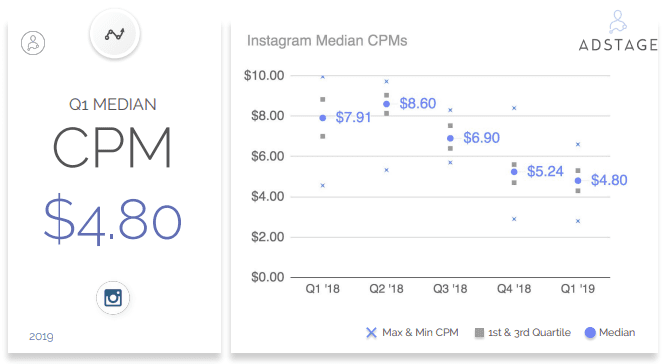
In Q1 2019, AdStage analyzed nearly 2.3 billion ad impressions and nearly 13 million clicks for ads on Instagram. Explore the Results Above
Related:
- Instagram Marketing Trends and Benchmarks Report, 2019 | Iconosquare
- The 2019 Instagram Stories Research | Socialinsider
LinkedIn Benchmark—Q1 2019
- LinkedIn audience network median cost per thousand impressions (CPM) is $7.85 in the first quarter of 2019 which is jumped 28 cents than the last quarter.
- LinkedIn cost per thousand impressions (CPM) increased by 3.7% since Q4 of 2018.
- LinkedIn CPM increased with a year over year rate of 15.3% since Q1 of 2018 which means over a dollar more expensive.
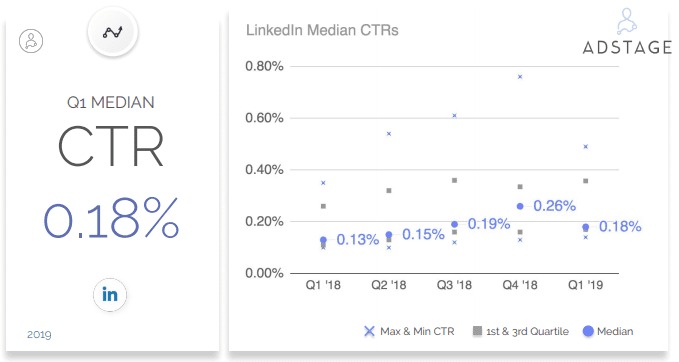
In Q1 2019, AdStage analyzed nearly 2 billion ad impressions and just over 4 million clicks for ads on LinkedIn. Explore the Results Above
Twitter Benchmark—Q1 2019
- Twitter audience network median cost per click (CPC) is $0.49 in the first quarter of 2019 which is jumped just 9 cents since the last quarter.
- Twitter cost per click (CPC) increased by 22.5% since Q4 of 2018.
- Twitter CPC decreased with a year over year rate of 29% since Q1 of 2018 which is 11 cents more expensive.
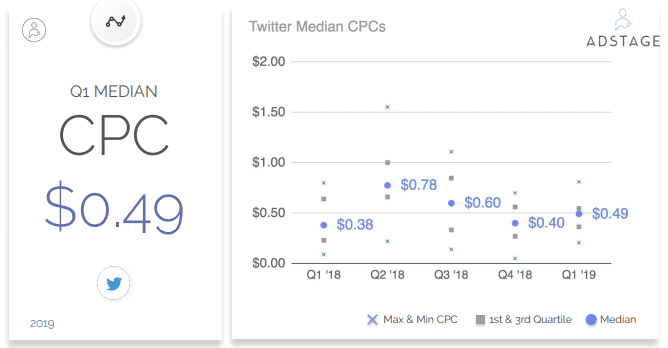
In Q1 2019, we analyzed over 139 million ad impressions and over 1.4 million clicks for ads on Twitter. Explore the Results Above
The Content of the “AdStage’s Paid Media Benchmark, Q1, 2019″ Report:
- Introduction
- About Adstage
- Methodology
- Facebook Benchmark
- Audience Network
- News Feed
- Messenger
- Instagram Benchmark
- Linkedin Benchmark
- Twitter Benchmark
- Google Ads Benchmark
- Google Display Network Benchmark
- Youtube Benchmark
- Bing Ads Benchmark
- Trends Benchmark
- Resources
Number of Pages:
- 53 Pages
Pricing:
- Free
Methodology:
Benchmark metrics are representative of AdStage customers whose ad accounts are in USD currency. AdStage made no claims that their benchmark metrics are indicators of a network’s performance at large.
Customers’ ad account metrics are summarized at daily intervals. These summaries are further aggregated to determine the median performance at monthly and quarterly intervals.
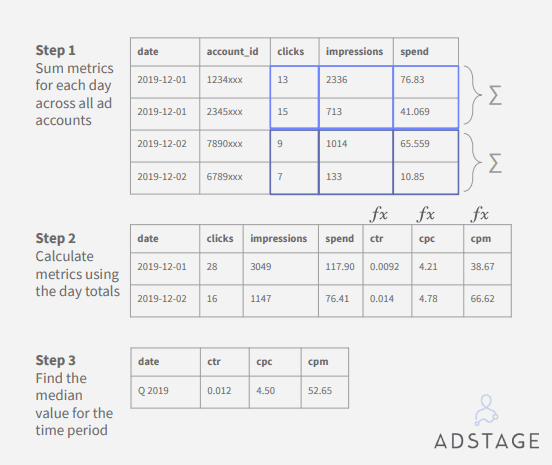
AdStage’s Paid Media Benchmark Report – Q1 2019 Methodology
Warning: Undefined array key "sidebar_ads" in /home/dmc/public_html/wp-content/themes/DMC/functions/helpers.php on line 824
