Mobile Shopping Apps Report 2020 | LiftOff
E-Commerce & Retail
|
Warning: Undefined array key 0 in /home/dmc/public_html/wp-content/themes/DMC/single-report.php on line 21
Warning: Attempt to read property "name" on null in /home/dmc/public_html/wp-content/themes/DMC/single-report.php on line 21
It is noticeable that mobile shopping apps are the go-to when it comes to online shopping. Mobile shopping apps continue to experience significant growth rates.
According to eMarketer, global mobile commerce sales have rocketed nearly 3x in just four years, from under $1 trillion four years ago in 2016 to nearly $3 trillion in 2020. Also, sales are expected to be worth $3.56 trillion in 2021.
Well, let’s check the insights of mobile shopping apps.
Mobile Shopping Apps Install to Action Times:
- It is reported that overall shoppers are fast movers, which means that after downloading the mobile shopping apps, they tend to make a decision to purchase in under 9 hours.
- Shoppers download shopping apps with a strong sense of purpose, they complete their registration within 16 minutes only.
- However, it should be mentioned that users also do some research before taking the plunge, and this explains why it takes them around 8 hours and 53 minutes to commit to a purchase after the install the app.
- However, the bottom line is the install-to-action time for shopping apps is much shorter than for utilities and gaming apps. As for these categories, users take days not only hours to convert.
The figure below shows mobile shopping apps install to action time.

Shopping Apps Costs & Conversion Rates:
Obviously, numbers align to show that mobile shopping apps are strongly entrenched in consumers’ normal routine. Besides, CPIs are a steal at $2.87 and costs through the funnel are affordable.
Impressive engagement rates, the impact of global events, and low costs position shopping apps for their biggest year yet.
Check the mobile shopping apps costs and conversion rates below for further information.
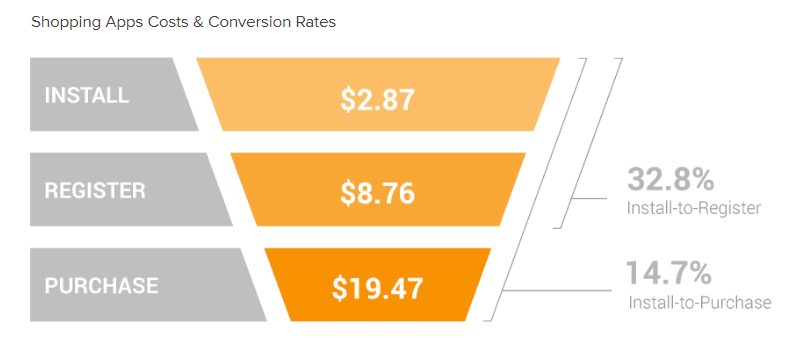
- It is shown that there is a percentage of 32.8% who falls under the category “Install-to-Register”
- On the other side, a percentage of 14.7% falls under the category “Install-to-Purchase”
Shopping App User Retention by Platform:
When it comes to iOS, it clearly offers a higher retention rate across the board. The following chart shows the shopping app user retention by platform (Android, iOS)
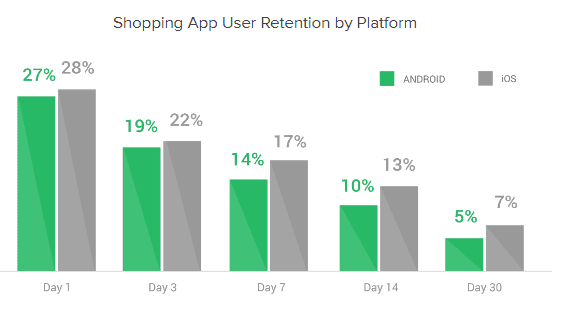
- As we see, retention rates for the shopping apps on iOS outperform Android at every point on the curve, along with the difference which comes in between 1% to 3%.
- It should be mentioned that even an incremental uplift in retention is considered to be a huge help for marketers who are focused on keeping users coming back (While controlling UA costs in the process).
“Run a lot of tests – and often. But zero in on metrics such as customer lifetime value. Use LTV as the measure of whether your investments are driving positive results and be prepared to change your strategy quickly if the numbers don’t add up.” Vinícius Campos – Performance Marketing Coordinator LatAm
Make sure to check the full report for the full insights about mobile shopping apps in 2020.
The Table of Content of “Mobile Shopping Apps Report 2020”:
- Introduction
- Highlights
- Methodology
- Global trends and benchmarks
- Engagement by platform
- Monthly trends
- Regional benchmarks
- Country deep dives
Number of Pages:
- 42 pages
Pricing:
- Free
Methodology:
Data were driven from an analysis of 129 apps, 53 billion impressions, 558 million clicks, 10 million installs, and 2 million first-time events. The analysis was conducted during Apr 1, 2019, and Apr 1, 2020.
Warning: Undefined array key "sidebar_ads" in /home/dmc/public_html/wp-content/themes/DMC/functions/helpers.php on line 824


