Facebook Video (Study) | Socialinsider
Video Marketing | Global
It is known that video content has always been a highly engaging part of the Facebook experience. However, the questions remain, how many pages have included videos in their digital strategy? What’s the ideal video length for greater engagement? Who goes live on Facebook?
The answer is within over 10.5 million video posts which answer all the questions above. Within this report, you will know all the best practices on how your business can create video content for Facebook that converts and engages.
Let’s dive deep into the report for more insights!
15% of All Facebook Content Is Video – An Increasing Percentage:
Facebook video content includes both videos uploaded to the network as well as live streaming videos.
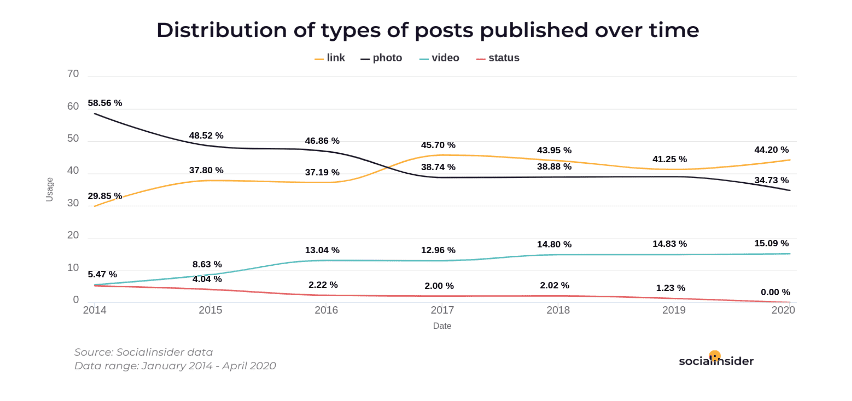
The below graph shows the distribution of types of posts published over time
- There is no doubt that the introduction of video format has a great impact on social media.
- The data shows that video content has always been on the rise. Slowly, but surely, more and more brands choose this type of post year by year.
- When it comes to Facebook video marketing, it appears steadily on the rise. In 2020, it is reported that 15% of Facebook content is video.
- This represents a clear contrast to 2014, where the number of video posts published by brands on Facebook was only 5.47%.
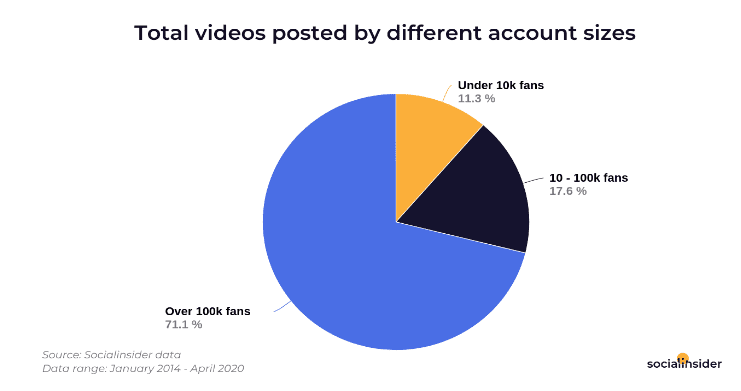
Video Content Takes Over: Bigger Accounts of Over 100k Fans Published 71% of the Videos
It is reported that the majority of Facebook video content is posted by bigger accounts which are typically owned by bigger brands.
- Also, pages with fewer than 10,000 fans own 11.3% of video posts.
- On the other hand, pages with a fandom of between 10-100K published 17.6% of all Facebook video content.
The chart below shows the total video posted by different account sizes.
The Table of Content of “Facebook Video (Study) Report”:
- Introduction
- Summary
- Key Findings
- 15% of all Facebook content is video – an increasing percentage.
- Bigger accounts of over 100k fans published 71% of the videos
- Vertical videos with description lengths of over 300 characters can raise engagement rates from 0.18% to 0.39%
- Vertical videos versus landscape videos
- Longer descriptions draw in more people
- The optimal video length for better engagement is between 2 and 5 minutes
- Only 12% of the video posts are live, despite generating double the engagement.
- Live Videos that last over 1-hour increase engagement from 0.19% to 0.86%
- Methodology
Number of Pages:
- 21 pages
Pricing:
- Free
Methodology:
To identify the best strategy for video content on Facebook, we analyzed more than 10,596,877 of video posts from a total of 119,032 business pages.Within this report, we provide a representative sample of US and international brands that had an active presence on Facebook between 2014 and April 2020. These pages had Facebook fan counts between 5,000 and 1 million as of the same date. We define engagement as measurable interaction on Facebook posts, including likes, comments, and reactions.
The engagement rate is calculated based on all these interactions divided by the total follower count. The Facebook data was also analyzed based on page size, defined by the total number of fans that liked the business pages from the Socialinsider database. We used Socialinsider to find out the engagement rates, the frequency of posting, post types, video length, and to analyze the performance of native video content compared with live streaming.

Socialinsider
- Explore in-depth insights for any social media profile.
- Enhance social media strategy.
- Win pitches and maximize the revenue per client by driving engagement, improving the content strategy, and creating automated reports with ease.
- Measure your clients’ profiles.
- Perform competitive analysis in minutes across Facebook, Instagram, Twitter, and Youtube.
- Benchmark your channels.
- Add context to your digital strategy.
- Branded reports in seconds.
- Reports delivered to your inbox.
- Validate your social media efforts with reliable data, share the performance with your team and clients.
Services & Features:
- Facebook Analytics.
- Facebook Video Insights.
- Instagram Analytics.
- Twitter Analytics.
- YouTube Analytics.
- Hashtag Analytics.
- Instagram Stories Analytics.
- Facebook Boosted Post Detection.
- Competitor Tracking.
- Benchmarking.
- Downloadable reports (PDF, PPT).
- Downloadable posts (CSV).
- Automated reports.
- Reports in your language.
- API Access.
- Livechat and email support.
Pricing:
- Social Media Manager: $59 per month.
- Small Agency: $99 per month.
- Agency: $199 per month.

