The Emoji Report, 2017 | Brandwatch
Consumer Behavior | Global
There is no chat in our today’s social media interaction with no emojis that have become an integral part of our written communications. On average 250 million emojis are posted online each month varies from positive and negative ones.
Take a quick glance at the Brandwatch’s new emoji analysis which analyzed over 6 billion emojis within 100 brands on Twitter;
The Most Used Emojis:
- Emojis of joy are the most used with a rate of 31%, followed by disgust emojis with a rate of 21%.
- Females are more likely to use emojis than males (61% vs. 39%). They’re also more likely to use negative emojis.
- Three-quarters of the emojis on Twitter are positive ones, compared only a quarter which are negative.
- There is an increase of 9.5% in using negative emojis which grew from 23.2% to 25.4%.
- The largest volume of negative emojis was recorded during the month of the American election (8th November 2016) which grew to 28.9%.
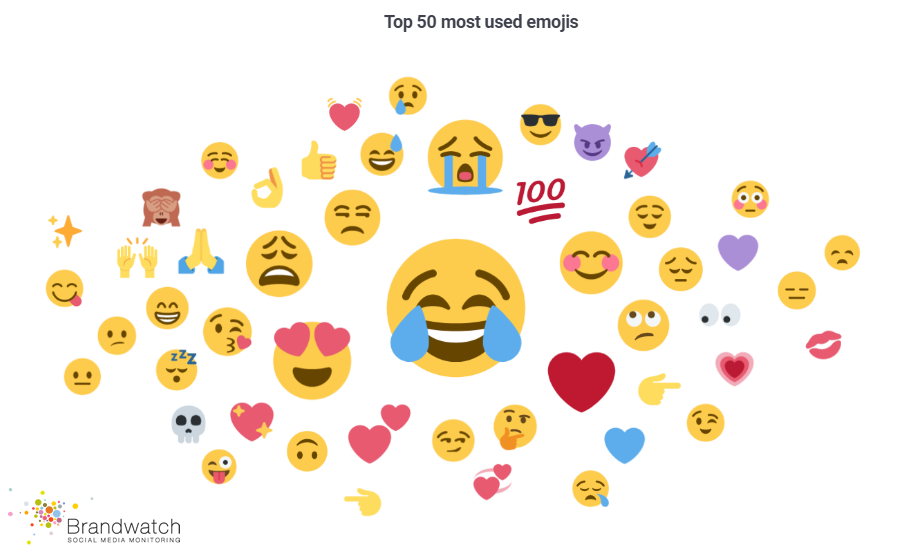
The Most Popular Emojis Are Smileys, Hearts, Humans, and Hand Gestures — 2017 Data
Related Study: Adobe Emoji Trend Report 2019
How Consumers and Brands Use Emojis
- Since September 2015 the volume of tweets containing a brand name and an emoji has grown by 49%.
- Pantene, Jameson, Subway, InterContinental Hotels, and Tesla are the top 5 brands that used positive emojis.
- By grouping several brands by industry to determine the most positive and negative industries, “Hotels” lead the way due to positive customer experiences, reward schemes, and great customer service.
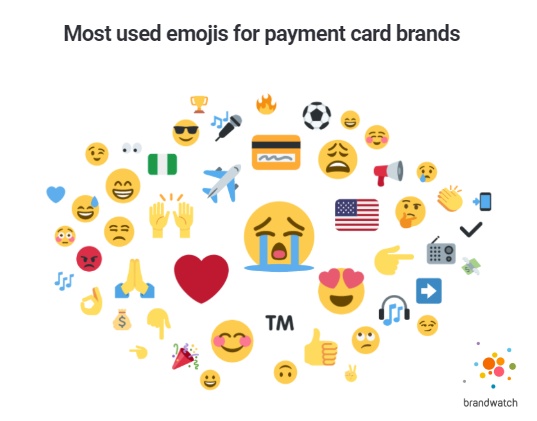
The Most Used Emoji by Payment Cards Brands
The Content of “The Emoji Report“:
- How we use emojis
- The most popular emojis
- Positive vs negative
- Most used emotions
- When emojis are used
- How men and women use emojis
- How people around the world use emojis
- How consumers and brands use emojis
- The most positive brands
- The most positive and negative industries
- Summary
- Expert Conclusions
- Methodology
- Scope
- Brandwatch Analysis
- Brand selection
- Determining positive and negative emojis
- Try Brandwatch’s Emoji Analysis
Number of Pages:
- N/A
Pricing:
- Free
Methodology:
Data based on an analysis of a statistically accurate 10% sample of Twitter within a two-year time period from Sept 1st, 2015 – Sept 30th, 2017. The Emoji Report analyzed 6 billion emojis within 100 brands in total.
