Digital VS Traditional Media Consumption Global Trends Report, 2019 | GlobalWebIndex
Consumer Behavior | Global
Internet users are moving from being more of a passive audience to active producers, contributing directly to the discussion and even posting content to their social media accounts. The shift from traditional to digital media is much discussed but rarely quantified.
In this report, GlobalWebIndex offers a unique perspective on day-to-day media consumption behaviors by age and across markets analyzing how much time people are spending online, tracking the types of media they are consuming and assessing the share of time spent on digital versus traditional forms of television and print press.
This generates easily comparable data which enables us to estimate the total time spent across markets or consumer segments. Although digital media shares many of the same functions of traditional media, there are many differences that exist between the two in terms of the relationships between users and the information put out by brands.
Let’s delve deeper into the report’s main results;
An Overview of Traditional and Digital Media Consumption 2019:
- Internet users are most likely to be social networking when they second screen with a rate of 63%.
- 16-24s are clocking up almost 7 ¾ hours per day online, with 46% of this time being spent on their mobiles which is 3 hours and 15 minutes.
- In many fast-growth markets, mobiles are now capturing more than 50% of online time – most importantly China.
- There are strong market-by-market variations in the total daily time devoted to media, Thailand tops the table on a substantial 13 hours and 42 minutes, followed by Brazil and the Philippines both in excess of 13.5 hours.
- Over 85% are using another device as they watch television while socializing with friends and family through social media and messaging services is the most common simultaneous activity, some 8 in 10 also read news and play games.
- Time spent online and on gaming consoles accounts for 80% of all media time among 16-24s, but just 50% for 55-64.
- 16-34s are the only age group to be watching more than an hour of online TV per day, they are also the heaviest social networkers, devoting about over 2.5 hours a day to social networks/services.
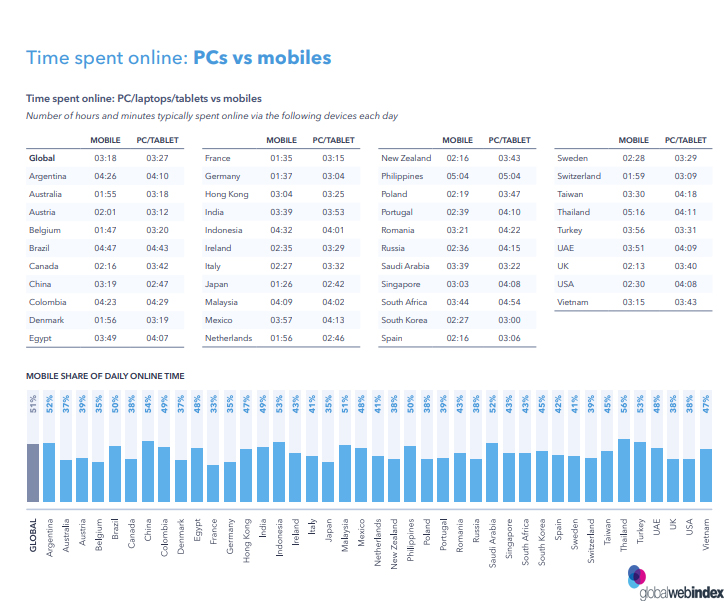
A Figure Shows the Share of Time Spent Online Using PCs vs Mobiles, 2019
Related Report: Measuring Media Impact, 2019 | Ipsos
The Content of “Digital Vs. Traditional Media Consumption 2019” Report:
- Definitions.
- Key stats and trends.
- Global trends in media consumption.
- Media consumption by age.
- National differences in media consumption.
- Traditional vs digital: TV, radio and press.
- Notes on methodology.
- More from GlobalWebIndex.
Number of Pages:
- 42 Pages
Pricing:
- Free
Methodology:
Data is based on interviewing over 550,000 internet users aged 16-64 by GlobalWebIndex, respondents completed an online questionnaire that asks them a wide range of questions about their lives, lifestyles, and digital behaviors.


