iOS Engagement Rates Are 23.8% That Is Almost 2X Higher Than Android
E-Commerce & Retail | Global
Mobile Shopping Apps: Engagement by Platform
It is remarkable that Android costs are attractive at every stage of the journey, however, iOS shines brighter with consistently higher engagement and retention rates.
The following chart is for the shopping apps costs and conversion rates by platform (Android, iOS)
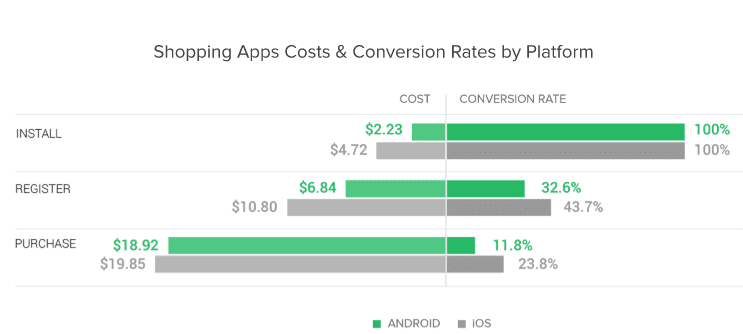
- Obviously, Andriod has the edge in UA cost, however, iOS excels in conversion as it offers 2x higher engagement rates where it counts.
- As we see, when it comes to installation, the cost to acquire an Android user is $2.23 which is extremely attractive.
On the other hand, the positive is overshadowed by negatives deeper in the funnel. - Talking about register, as shown, the cost to acquire an Android user who actually completes a registration is nearly 40% less expensive than for iOS. Anyhow, iOs still leads with high engagement rates with a percentage of 11.1%
- When it comes to purchasing, bear in mind that the cost to acquire an Android user is less than $1 cheaper than for iOS. iOS engagement rates are 23.8% that is almost 2x higher than Android.
Retention Rates in The US Lag Behind North America Overall
Retention rates in the US lag behind North America overall but are significantly stronger than the previous year.
Check the figure below for the USA shopping apps user retention.
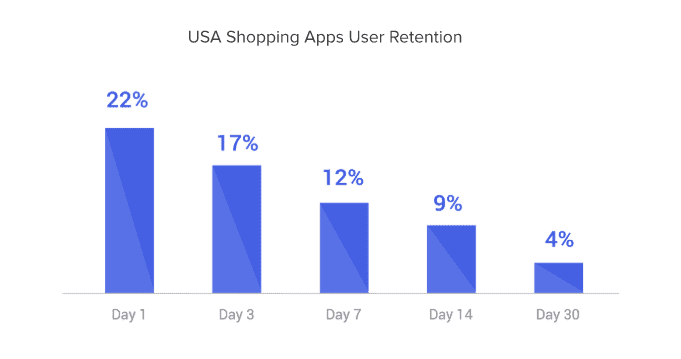
- The chart shows that Day 1 user retention was 22%.
- Day 3, it decreased to 17%.
- It keeps on decreasing, on Day 7 it was 12%.
- Day 14% it was 9%.
- Reaching Day 30, it was 4%.
As shown retention rates at every stage of the curve are lower than the region. This suggests that marketers should go the extra mile and drive deeper connections.
Anyhow, performance is stellar compared to the previous year, when the decline in retention rates was far more dramatic and rates for Day 1 and Day 7 were 7% slower.

