The Average Facebook Engagement Rate Across Industries Benchmarks 2019 to 2023
Social Media Insights | Global
Facebook engagement rates have been changing over the last few years, this is why in this post we will show you the benchmarks for Facebook over the years.
Facebook Average Posts per Day in 2019:
- The media industry is ranked as the industry with the highest average posts per day on Facebook with a rate of 8.18 posts.
- Sports teams come next with an average of posts per day on Facebook with a rate of 2.95 posts.
- The retail industry is also listed with an average of posts per day rated with 1.13 posts.
Connect your online and offline marketing now with each other to improve reporting, efficiency, and personalization by integrating with incredibly powerful technologies from Adobe Campaign.
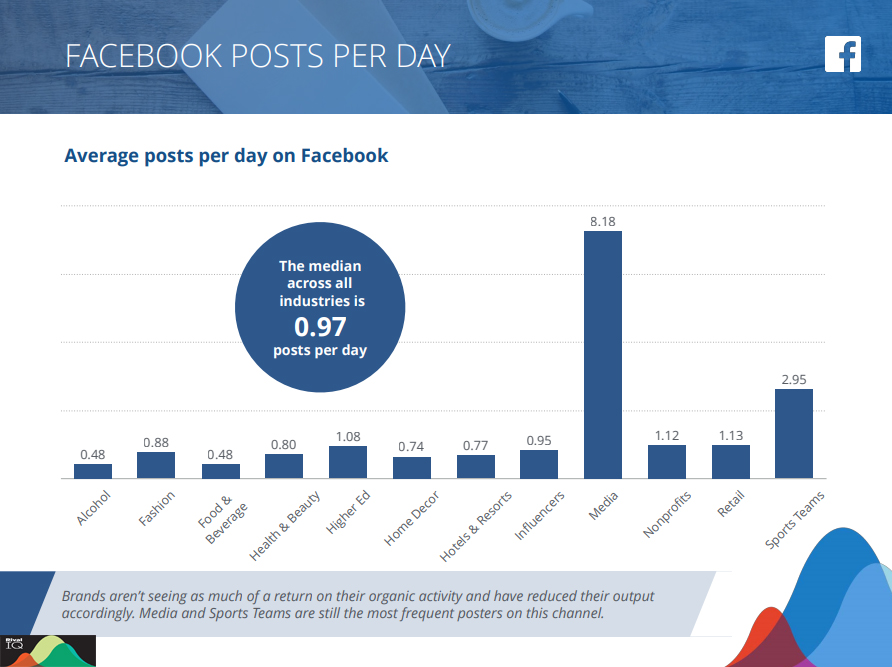
A Graph Shows the Average Posts Per Day on Facebook Across Industries—2019 Data
The Average Facebook Engagement Rate in 2019:
- The alcohol industry is ranked as the top industry with an average engagement rate per post on Facebook of 0.14%.
- Sports teams, non-profits, hotels & resorts come next as industries with an average engagement rate per post on Facebook of 0.13%.
- Food & beverage, higher Ed, and influencers are also listed as industries with average engagement rates per post on Facebook of 0.12%.
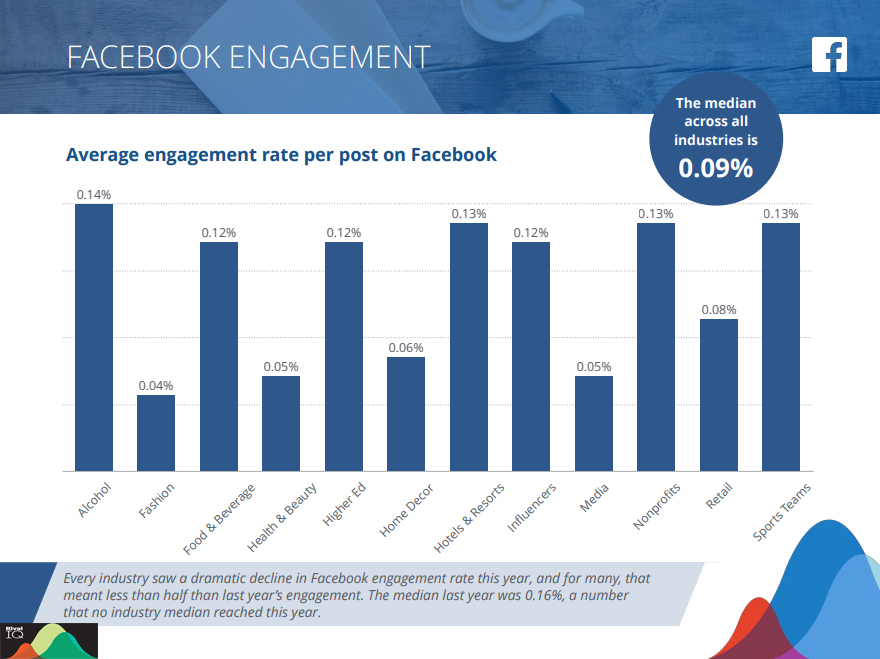
A Graph Shows the Average Engagement Rate Per Post on Facebook by Industries—2019 Data
Related Post: The Average Instagram Engagement Rate Across Industries Benchmarks 2020 Vs. 2019
The Average Posts Per Day on Facebook Across Industries in 2020 VS 2019:
Facebook Average Posts per Day in 2020:
- The media industry is still ranked as the industry with the highest average posts per day on Facebook with a rate of 7.51 posts, even though it decreased from last year.
- The median across all industries is 0.83 posts per day.
- The Sports Teams industry ranked second place with an average post per day on Facebook with a rate of 3.43.
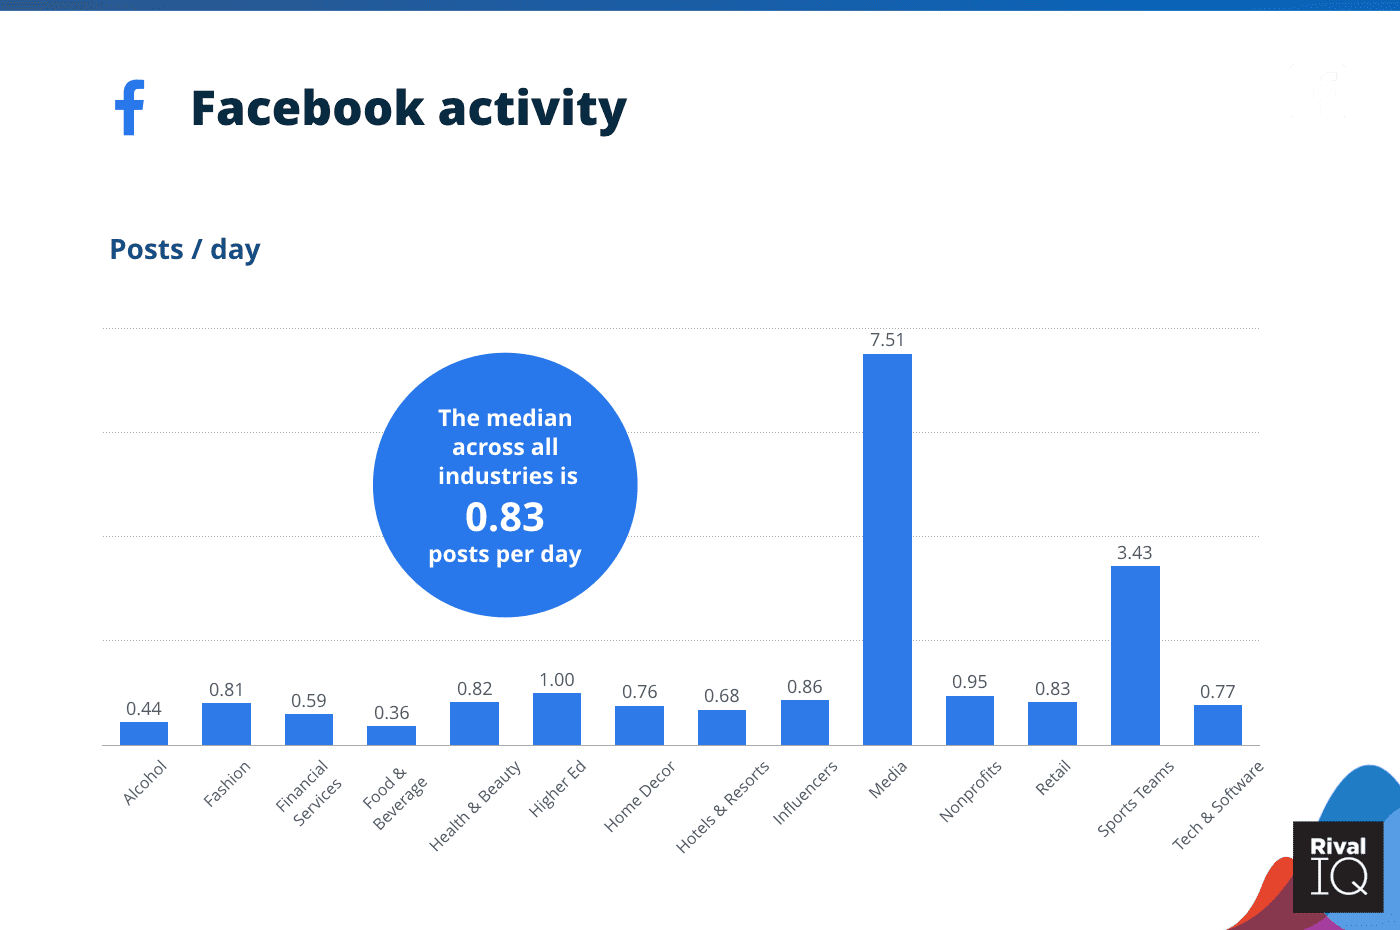
A Figure Shows the Average Posts per Day on Facebook Across Industries— 2020 Data
Facebook Posts VS. Engagement Rate Across Industries 2020:
The Average Facebook Posts Vs. Engagement Rate Across Industries in 2020:
- Unlike last year, the Sports Teams industry is ranked as the industry with the highest Facebook engagement rate of 0.18% with posts per day rate of 4.
- Influencer and Higher Education Industries come next with a Facebook engagement rate of 0.13% with posts per day rate of 2.95.
- Moreover, it has been reported that brands are consistently most active on Facebook.
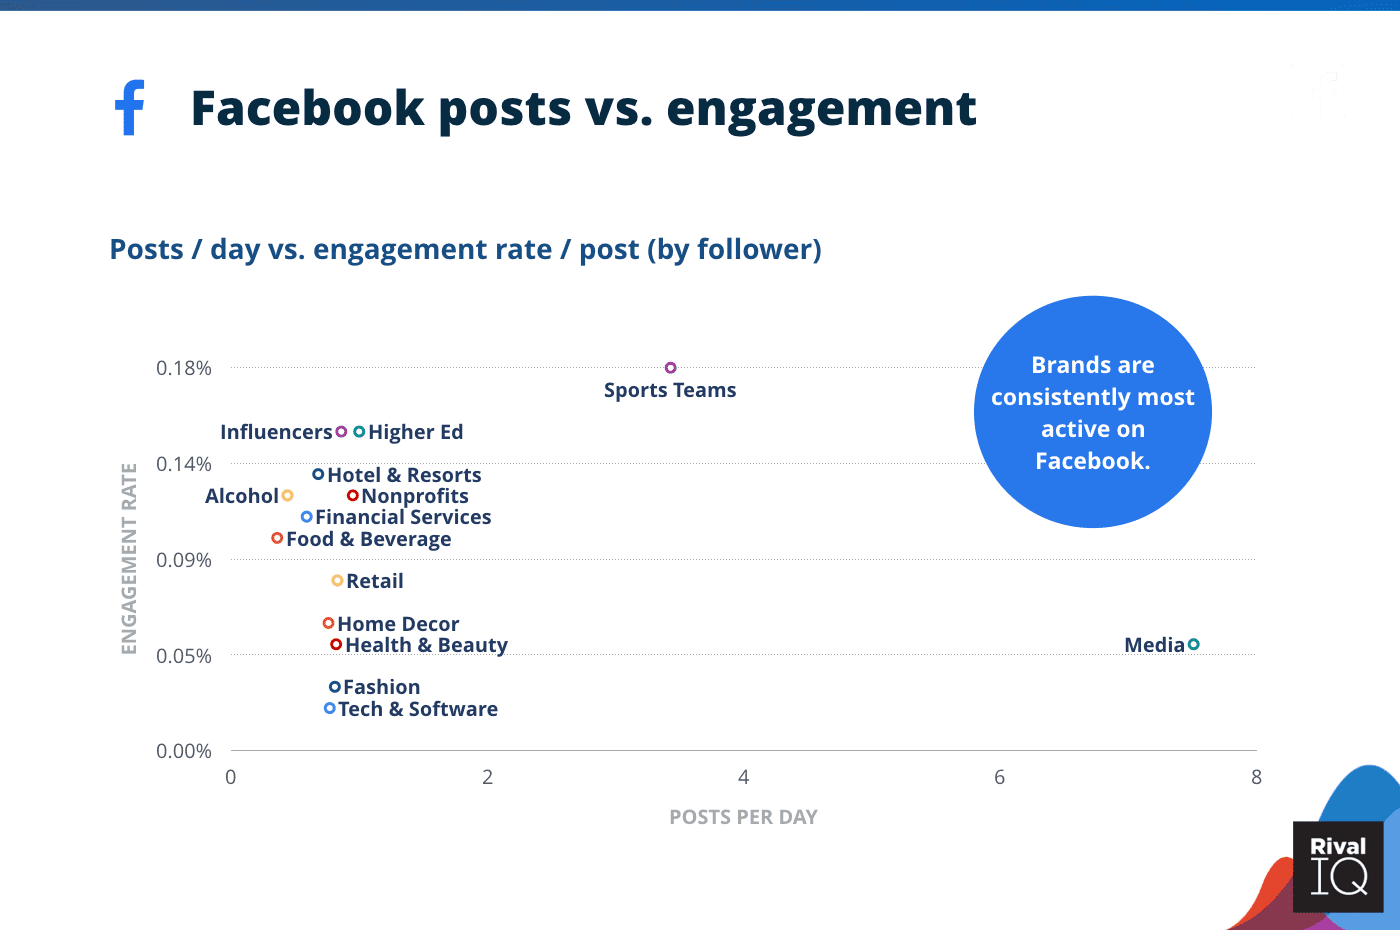
A Figure Shows the Relation Between the Average Facebook Posts and Engagement Rate Across Industries—2020 Data
You can build unique audience profiles using a data management platform such as Adobe Audience Manager easily.
Facebook Engagement Rate Across Industries 2020:
Engagement is defined as a measurable interaction on social media posts, including likes, comments, favorites, shares, and reactions. The engagement rate is calculated based on all these interactions divided by the total followers/fans count.
The Average Facebook Engagement Rate in 2020:
- The all-industry Facebook median engagement rate stayed flat in 2020, it was 0.09% across all industries.
- However, industries decreased their posting frequency on Facebook by about 14% this year.
- The top Facebook performer is “Sports Teams”. It posted 2x the median posts per day.
- On the other hand, Media’s performance shows that more frequent is not always good.
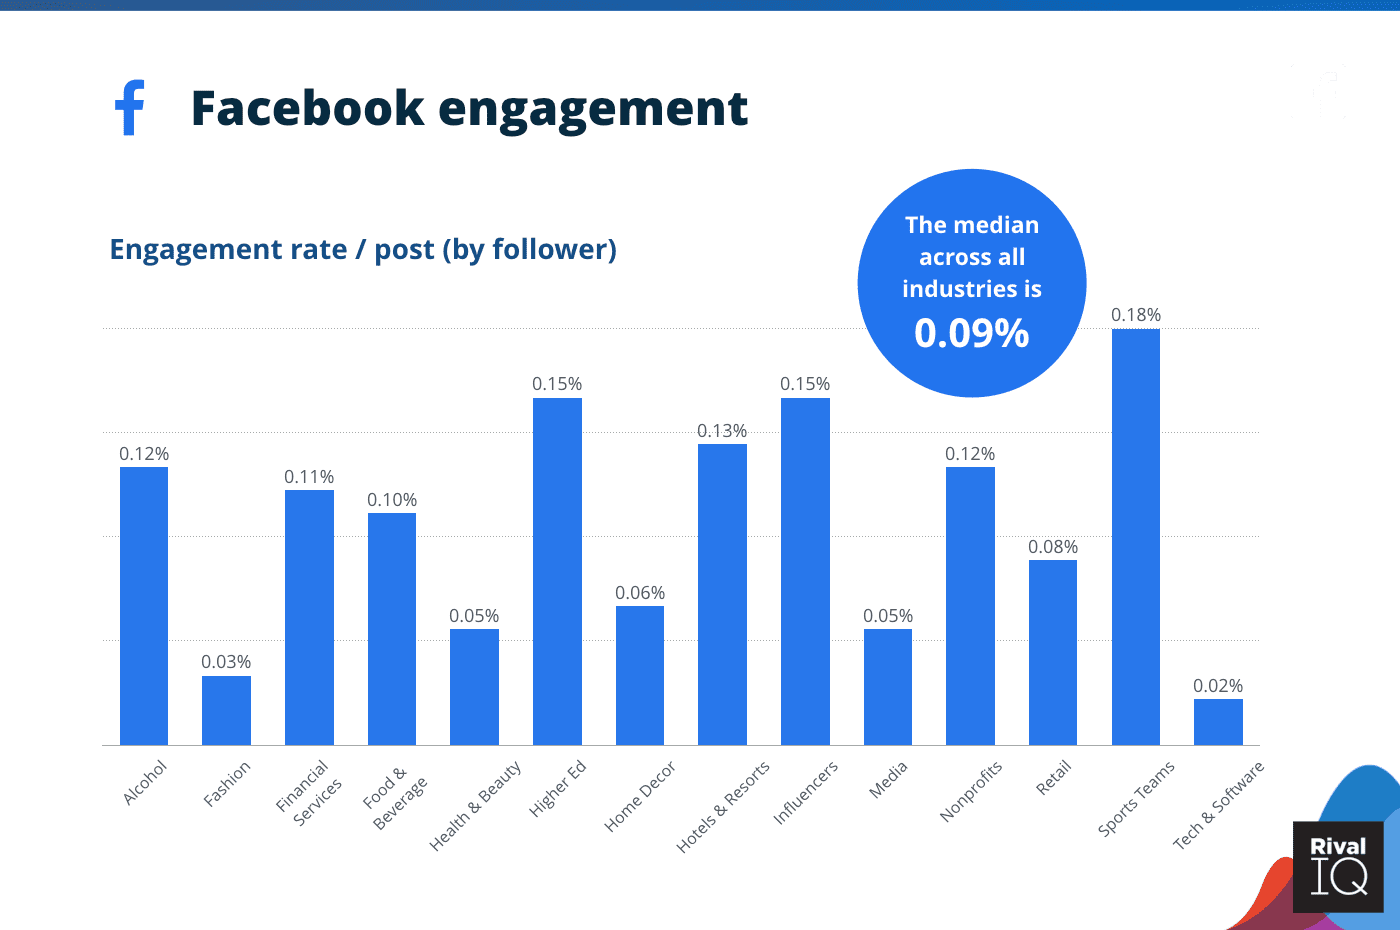
A Graph Shows the Average Facebook Engagement Rate Per Post Across Industries —2020 Data
Facebook Engagement Rate 2022:
Also, the latest from RivalIQ’s 2022 Social Media Industry Benchmark Report says the median engagement rate on Facebook is now 0.064%.
On the other hand, other median rates are not any better, with Instagram engagement rate at 0.067% and Twitter engagement rate at a measly 0.037%.
The question is what is the engagement rate formula? The engagement rate formula is to calculate the real engagement rate of a post, and this is by using the following formula: the number of interactions divided by the true reach and multiplied by 100.
Shown above is the F
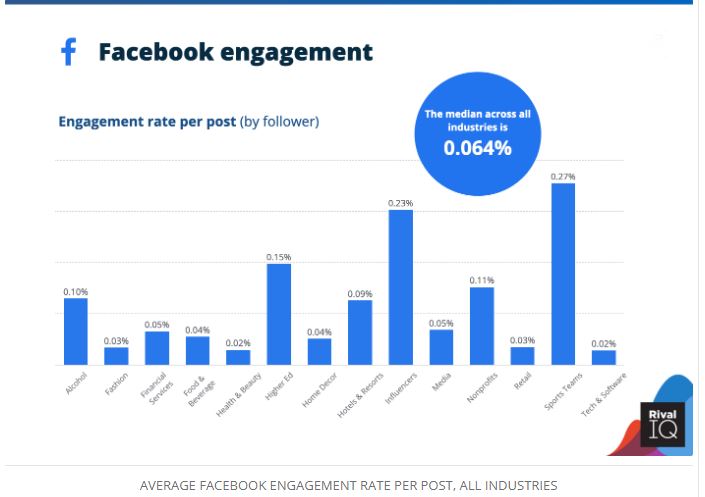
acebook engagement rate 2022 by followers, which stayed declined a little bit this year, though Higher Ed and Sports Teams were able to boost their engagement rates.
In the following chart is Facebook posts VS engagement rate:
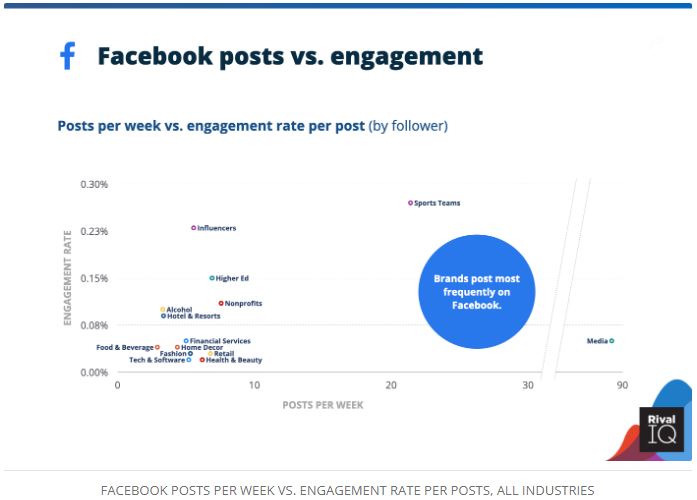
According to RivalIQ’s Facebook engagement rate 2022 report, Influencers (infrequent posters) and Sports Teams (frequent posters) earn consistently high marks on Facebook despite a big delta in posting frequency.
Related Tool: Create and publish your Facebook ads more easily with GetResponse now!
And Facebook activity:
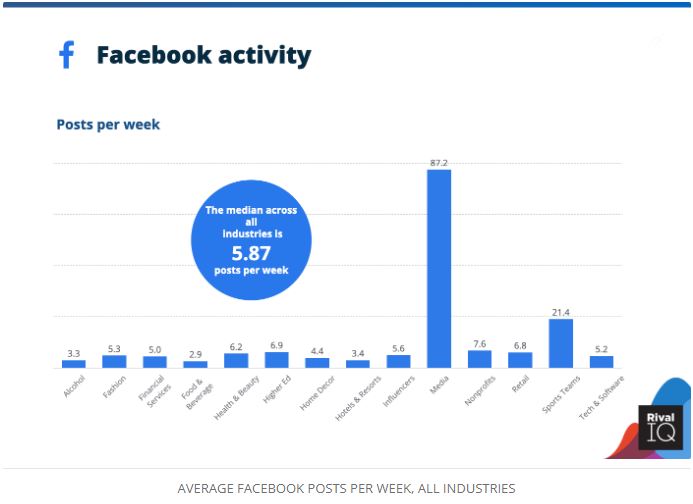
As shown in the Facebook activity graph, the median across all industries is 5.87 posts per week. The median has increased a little bit this year.
Control all your social media through one tool with Fanpage Karma now, analyze, publish, communicate, research, and present now.
Not only that but we also provide all the Facebook engagement rate benchmark across all industries in 202 and 2019, keep on reading…
Rival IQ has released its 2020 Social Media Benchmarks Report includes everything you need to know to benchmark your social media success on Facebook, Twitter, and Instagram against your competitors across these.
Regarding Facebook, it represents a continually evolving marketing platform and communication channel especially given the recent news coverage and insights. So, In this post, we’re focusing on Facebook engagement rate across industry benchmarks.
As marketers, we routinely hear customer/prospect insights about their views of all social media channels which require us to make well-informed, digitally-driven decisions on what ways to communicate with our audience.
Facebook Engagement Rate 2023:
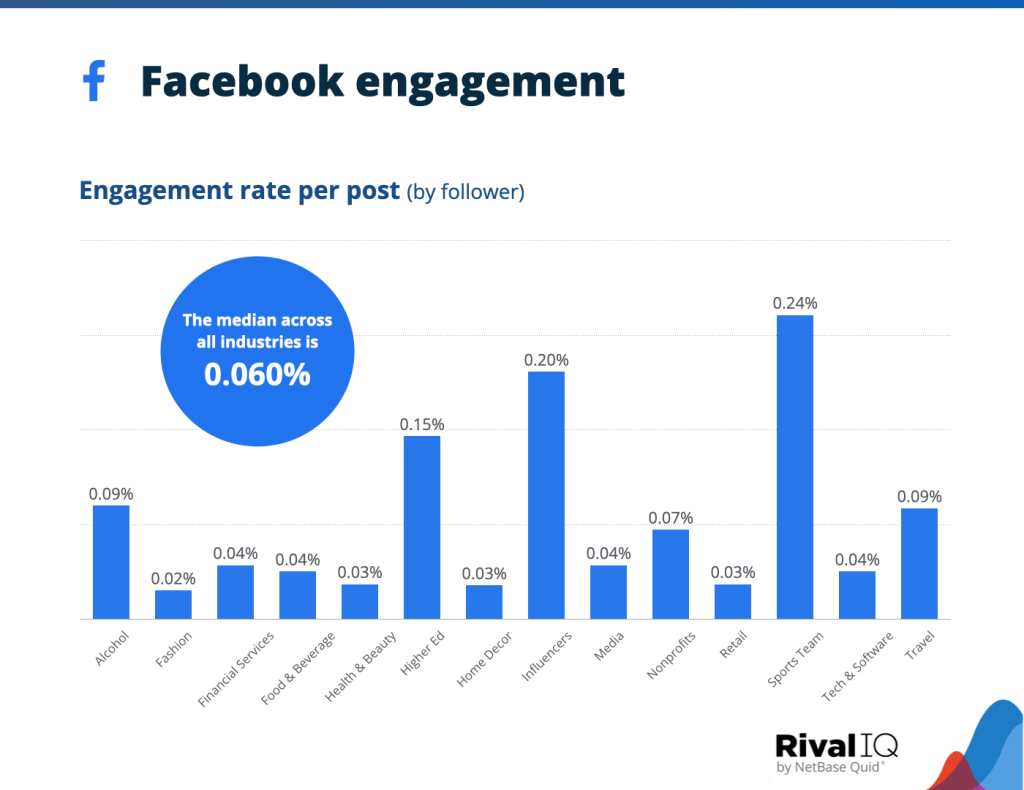
This graph shows the Engagement rate of Facebook according to each industry:
- The highest is Sports
- And the Second Highest is influencer’s content.
